In engineering, automation, and data analysis, the word “linear” appears everywhere: linear regression, linear equations, linear motion, linear modules, and linear actuators. But these terms do not always mean the same thing. A mathematical model can be linear even when the physical machine moves in complex ways, while a motion system can produce straight-line travel even if its control behavior is nonlinear under load, friction, acceleration, or backlash. For manufacturers, machine builders, and engineers selecting a linear motion module, understanding whether a model is linear helps improve sizing, prediction, tuning, quality control, and procurement decisions.
The simplest way to tell if a model is linear is to check whether the output changes by a constant amount for each equal change in input, whether the equation can be written as a sum of variables multiplied by constants, and whether a graph of the relationship forms a straight line. In regression, a linear model is linear in its parameters; in motion control, a linear approximation may be valid only within a defined operating range.
This guide explains how to identify linear models in mathematics, data analysis, and automation applications, then connects those ideas to linear actuators, linear modules, and real industrial motion systems.
What Does It Mean for a Model to Be Linear?
A model is linear when its output can be expressed as a constant plus weighted inputs without multiplying variables together, raising variables to powers, or applying nonlinear functions such as exponentials, logarithms, or trigonometric transformations to the unknown parameters.
In its most familiar form, a single-variable linear model looks like this:
y = mx + b
Where:
(y) is the output or response
(x) is the input or predictor
(m) is the slope
(b) is the intercept
For multiple inputs, the model becomes:
y = b_0 + b_1x_1 + b_2x_2 + … + b_nx_n
This structure is common in engineering calculations, cost estimation, machine performance prediction, and quality analysis.
Linear in Variables vs. Linear in Parameters
A key point often missed is that a statistical linear model must be linear in its parameters, not necessarily linear in the raw variables.
For example:
Model
Linear Model?
Why
(y = 3x + 5)
Yes
Straight-line relationship
(y = b_0 + b_1x)
Yes
Parameters are additive and first-order
(y = b_0 + b_1x + b_2x^2)
Yes, in regression terms
Linear in parameters, although curved in x
(y = ab^x)
No
Exponential relationship
(y = b_0 + b_1x_1x_2)
Usually nonlinear in variables
Contains interaction term, though can be modeled linearly if defined as a new feature
(y = \frac{a}{b+x})
No
The parameter appears in nonlinear form
This distinction matters in industrial automation. For example, a motion engineer may model required drive force as a linear function of payload mass:
F = ma + friction
Within a controlled operating range, the equation may work well. However, if friction changes with speed, temperature, lubrication, and seal conditions, the real system may become nonlinear.
Why Linearity Is Useful in Engineering
Linear models are popular because they are
Easy to calculate
Easy to interpret
Fast to optimize
Useful for prediction
Compatible with many control methods
In linear actuators and linear module systems, linear modeling can help estimate the following:
Required thrust
Stroke time
Positioning error
Load capacity
Deflection
Repeatability
Motor torque demand
Cycle time
Energy consumption
However, the model must match the physical reality closely enough for the decision being made.
How to Tell if a Model Is Linear from an Equation?
You can tell if a model is linear from an equation by checking whether the unknown coefficients appear only as first-power additive terms and whether the input-output relationship has a constant rate of change.
A basic linear equation has no squared output terms, no products of unknown parameters, no exponentials of unknowns, and no division by variables that change the relationship in a curved way.
Step-by-Step Equation Check
Use this checklist when reviewing an equation:
Identify the dependent variable
Usually (y), position, force, speed, current, temperature, or cost.
Identify the independent variables
Examples: time, distance, load, voltage, acceleration, stroke length.
Check the coefficients
A linear model has constants that multiply the variables.
Look for nonlinear operations
Squared terms
Cubic terms
Square roots
Logarithms
Exponentials
Sine/cosine functions
Variables multiplied together
Variables in denominators
Check the slope
If the slope stays constant, the model is linear.
Examples in Motion Applications
Application
Possible Model
Linear?
Practical Meaning
Constant-speed travel
Position = speed × time + start position
Yes
Position increases evenly with time
Force vs. payload
Force = mass × acceleration + friction
Approx. yes
Useful for actuator sizing
Belt elongation vs. load
Elongation = stiffness coefficient × force
Approx. yes
Valid below elastic limit
Servo response near setpoint
Error correction = gain × error
Yes
Common in linear control
Friction vs. speed with stick-slip
Nonlinear curve
No
Needs nonlinear compensation
Air resistance vs. speed
Drag proportional to speed squared
No
Not linear at high speeds
For a machine builder, a linear equation is often a good first approximation. But the final selection of linear actuators should also consider mechanical tolerances, duty cycle, vibration, contamination, and control requirements.
How to Tell if a Model Is Linear from a Graph?
A model is linear from a graph when the data points follow a straight-line pattern, which means equal changes in the input produce equal changes in the output.
Graphical inspection is one of the fastest methods for identifying linearity. If the plotted points form a line with a constant slope, the model may be linear. If the slope changes as the input increases, the relationship is likely nonlinear.
What to Look for on a Graph
When you plot data, look for these visual patterns:
Graph Pattern
Likely Model Type
Interpretation
Straight upward line
Positive linear
Output increases at constant rate
Straight downward line
Negative linear
Output decreases at constant rate
Horizontal line
Constant model
Output does not change with input
Curved upward line
Exponential or polynomial
The rate of increase accelerates
Curved downward line
Logarithmic or saturation model
The rate of increase slows
S-shaped curve
Nonlinear dynamic system
May involve limits, delay, or saturation
Scattered cloud
Weak or no relationship
A linear model may not be useful
Example: Position vs. Time
If a linear actuator moves at constant velocity, its position-time graph should be a straight line:
Position = Velocity \times Time + Initial Position
If the actuator accelerates, decelerates, or follows an S-curve profile, the position-time graph is not a straight line over the entire move. However, parts of the motion may still be locally linear.
A typical motion profile includes the following:
Acceleration phase
Constant velocity phase
Deceleration phase
Settling phase
Only the constant velocity phase is strongly linear in position versus time.
Using Residual Plots
A residual is the difference between the measured value and the predicted value:
Residual = Actual – Predicted
A well-specified linear regression model should have residuals that appear randomly scattered around zero. If the residuals form a curve, fan shape, wave pattern, or trend, the linear model may be missing an important nonlinear factor.
The U.S. National Institute of Standards and Technology provides useful guidance on regression and residual analysis in its Engineering Statistics Handbook.
How to Tell if a Model Is Linear or Exponential?
To tell if a model is linear or exponential, compare whether the output changes by a constant difference or a constant ratio as the input increases.
This is one of the most practical rules. A linear model adds the same amount each step. An exponential model multiplies by the same factor each step.
Linear vs. Exponential Comparison
Input x
Linear Output (y = 2x + 3)
Difference
Exponential Output (y = 3 \times 2^x)
Ratio
0
3
—
3
—
1
5
+2
6
×2
2
7
+2
12
×2
3
9
+2
24
×2
4
11
+2
48
×2
If the differences are constant, the model is linear. If the ratios are constant, the model is exponential.
Industrial Examples
In automation, exponential behavior may appear in:
Thermal rise during continuous operation
Battery discharge curves
Capacitor charging
Damping response
Failure probability over time
Some wear or degradation models
Linear behavior may appear in:
Constant-speed position over time
Elastic deformation within a safe range
Travel distance vs. pulse count
Cost vs. module length within a standard range
Force vs. mass at fixed acceleration
For example, if a stepper-driven screw axis moves 5 mm per revolution, then travel distance is linearly related to the number of motor revolutions. But if temperature rise increases rapidly under a high duty cycle, that thermal behavior may not be linear.
Semi-Log Plot Test
A useful technique is to plot the data on a semi-log graph:
If the original plot is straight, the model is linear.
If the semi-log plot is straight, the model may be exponential.
This method is common in reliability engineering, thermal modeling, and process control.
How to Tell if a Model Is Linear or Nonlinear?
You can tell if a model is linear or nonlinear by checking whether the relationship has a constant slope, additive structure, and predictable proportional response; if the slope changes with input, the system is nonlinear.
A nonlinear model may still be accurate and useful. In fact, many real-world systems are nonlinear. The question is not whether nonlinear is “bad,” but whether a linear approximation is accurate enough for the engineering decision.
Common Signs of a Nonlinear Model
A model is likely nonlinear if it includes the following:
(x^2), (x^3), or higher powers as the main relationship
(e^x) or exponential growth
(\log(x))
(\sin(x)), (\cos(x)), or periodic behavior
Saturation limits
Dead zones
Hysteresis
Backlash
Stick-slip friction
Variable stiffness
Temperature-dependent parameters
Nonlinearity in Linear Actuators
The term “linear actuators” describes devices that create straight-line motion, but their behavior may include nonlinear effects. Examples include:
Factor
Linear Approximation
Nonlinear Reality
Load vs. force
Force increases with mass
Friction and acceleration change dynamically
Position vs. command pulse
Fixed travel per pulse
Microstepping error, compliance, backlash
Speed vs. voltage
Higher voltage increases speed
Motor saturation and controller limits
Deflection vs. load
Elastic deflection proportional to force
Structural limits and resonance effects
Temperature vs. duty cycle
Predictable heat rise
Heat dissipation changes with environment
Wear vs. cycle count
Gradual increase
Contamination or lubrication failure can accelerate wear
This is why product selection should combine mathematical modeling with application testing. A ball screw linear stage may be ideal when high positioning accuracy, stiffness, and repeatability are required. But even with a precision screw drive, real performance depends on preload, guide rigidity, lubrication, mounting flatness, and control tuning.
Piecewise Linear Models
Many nonlinear systems can be approximated using piecewise linear models. Instead of forcing one straight line to fit all conditions, engineers divide the operating range into sections.
Example:
Operating Range
Approximation
Low speed
Friction-dominated behavior
Medium speed
Stable linear response
High speed
Motor torque drop and vibration effects
Near stroke end
Deceleration and settling behavior
This approach is especially useful in motion systems where one model cannot describe acceleration, constant velocity, and deceleration at the same time.
How Do You Identify a Good Linear Regression Model?
A well-specified linear regression model has a clear physical or statistical reason, strong fit within the operating range, random residuals, stable coefficients, and acceptable prediction error.
A high R-squared value alone does not prove that a model is effective. The model must also make sense, generalize to new data, and avoid misleading assumptions.
Key Indicators of a Good Linear Regression Model
Indicator
What It Means
Why It Matters
Reasonable coefficients
Parameters match engineering logic
Prevents false conclusions
Random residuals
Errors have no pattern
Suggests linear structure is appropriate
Low prediction error
The model predicts new cases well
Supports decision-making
No strong outliers
Extreme data does not dominate
Improves reliability
Stable coefficients
Small data changes do not reverse results
Indicates robust model
Valid operating range
The model is not extrapolated too far
Avoids unsafe decisions
Example: Predicting Required Actuator Force
Suppose you want to estimate actuator force using payload mass and acceleration:
Force = b_0 + b_1(Mass) + b_2(Acceleration)
This could be a useful linear model if:
The guide friction is relatively stable
The payload is mounted consistently
Acceleration range is controlled
The actuator is not near mechanical limits
Temperature does not significantly change performance
But if the system has high friction variation, flexible mounting, or vertical load changes, the model may need additional variables or nonlinear terms.
What Makes a Regression Model Poor?
A linear regression model may be poor if:
It fits historical data but fails in production.
Residuals show a curve or trend.
Coefficients contradict physical principles.
The model is used outside the tested range.
Important variables are missing.
Data quality is inconsistent.
The system includes control saturation, backlash, or dynamic vibration.
For industrial buyers, this matters because an incorrect model can lead to undersized actuators, unstable control loops, excessive wear, or poor repeatability.
How Does Linear Independence Relate to Linear Models?
Linear independence means that no variable, vector, or matrix column can be created as a combination of the others, which is important because dependent inputs can make a linear model unstable or impossible to solve uniquely.
The related question “how to determine if a matrix is linearly independent” often appears in linear algebra, regression, robotics, and control design. In practical terms, if your input variables are too similar, your model may not be able to clearly identify the effect of each variable.
How to Determine if a Matrix Is Linearly Independent
A matrix has linearly independent columns if none of its columns can be expressed as a weighted sum of the others.
Common methods include:
Row reduction
Convert the matrix to reduced row echelon form.
If every column has a pivot, the columns are independent.
Determinant test
For a square matrix, if the determinant is not zero, the columns are independent.
Rank test
If the rank equals the number of columns, then the columns are independent.
Null space test
If the only solution to (Ax = 0) is (x = 0), then the columns are independent.
Why It Matters in Regression
Suppose you build a model to predict cycle time using:
Stroke length
Travel distance
Commanded move length
If these variables always contain the same information, they may be linearly dependent. The regression model may still run, but coefficients can become unstable or meaningless.
Motion Control Example
In a multi-axis system, engineers may model position, velocity, acceleration, and torque. If two input signals are mathematically redundant, the model may fail to distinguish cause and effect.
Linear independence is also essential in robotics kinematics, where matrix rank can determine whether a system has full controllability in a certain direction.
How Does Linear Model Thinking Apply to Linear Actuators?
Linear model thinking helps engineers select linear actuators by simplifying complex relationships into predictable input-output rules for travel, speed, load, force, and accuracy.
This does not mean every actuator behaves perfectly linearly. It means linear assumptions can be used carefully to compare options, estimate performance, and reduce design risk.
Key Linear Relationships in Actuator Selection
Engineering Question
Linear Model Approximation
Design Use
How far will it move?
Distance = lead × revolutions
Stroke calculation
How fast will it move?
Speed = distance / time
Cycle time planning
How much force is needed?
Force = mass × acceleration + friction
Motor and drive sizing
How much will it deflect?
Deflection = force / stiffness
Accuracy estimate
How much does length affect cost?
Cost increases with stroke
Budget planning
How does pulse count affect travel?
Travel = pulses × resolution
Position command mapping
Common Types of Linear Actuators and Modules
Different linear module systems convert rotary or electromagnetic energy into straight-line motion. The best choice depends on load, speed, precision, environment, and duty cycle.
Type
Strengths
Typical Use
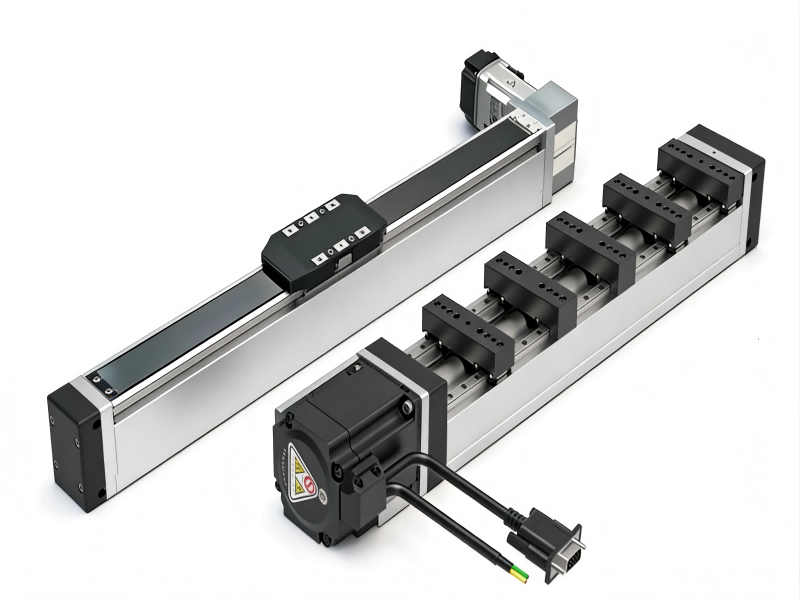
Belt-driven linear module
Long stroke, high speed, cost-effective
Packaging, transfer, pick-and-place
Ball screw actuator
High precision, high thrust, good stiffness
CNC, inspection, dispensing, assembly
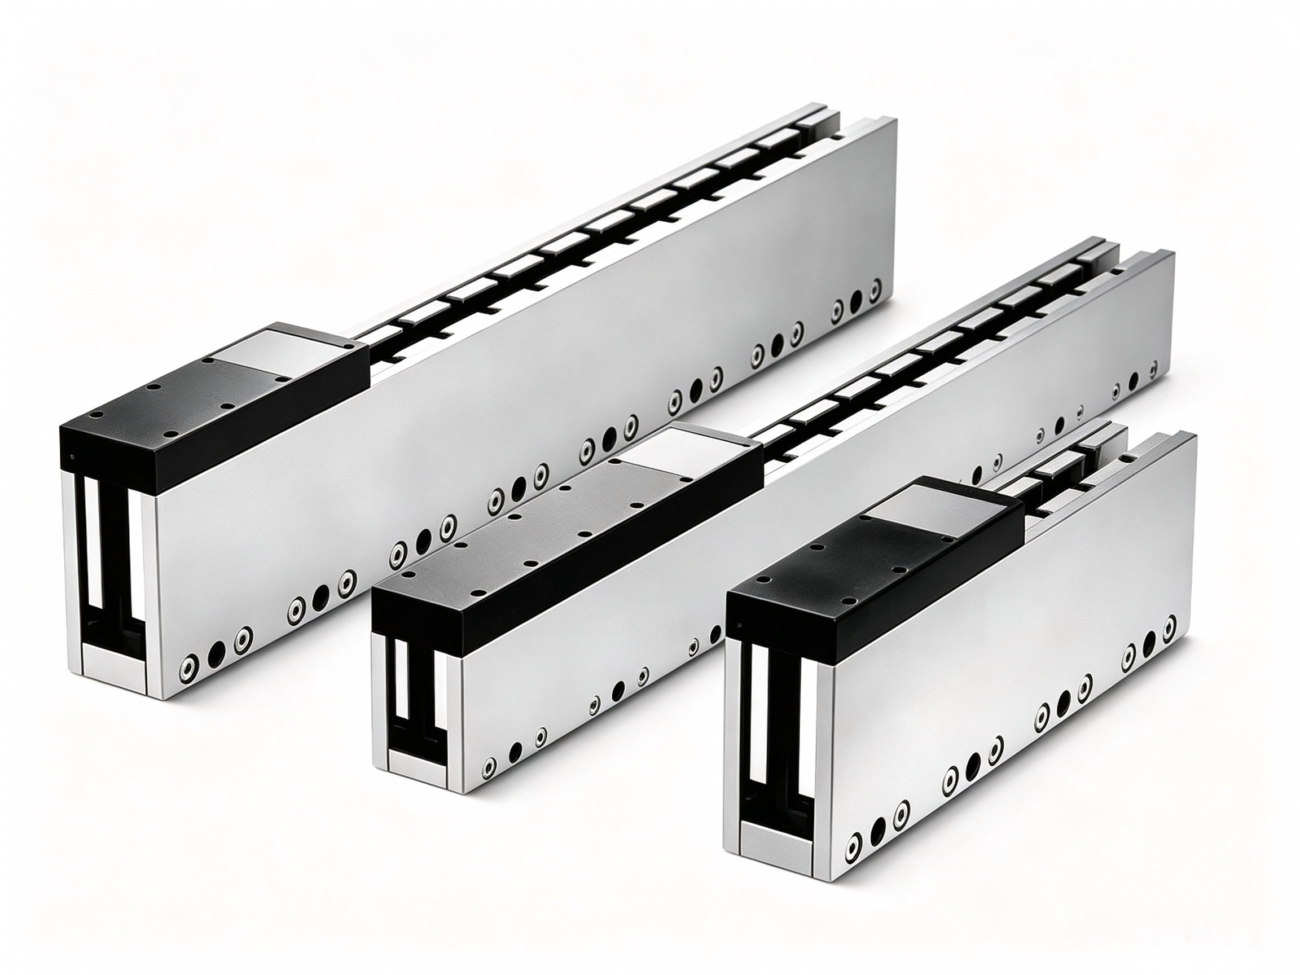
Linear motor stage
Direct drive, high speed, no mechanical screw backlash
Semiconductor, vision, precision automation
Electric cylinder
Compact thrust, servo control, replacement for pneumatic cylinders
Pressing, lifting, clamping
Embedded screw-slide table
Compact structure, integrated guide and drive
Space-limited automation equipment
A linear motor actuator is often selected when the application requires direct-drive response, high speed, and reduced mechanical transmission error. In contrast, screw-driven systems are usually preferred when thrust, holding force, and mechanical advantage are priorities.
When Linear Approximation Is Reliable
A linear approximation is usually reliable when:
The actuator operates within rated load limits
Speed and acceleration are moderate
The structure is rigid
Friction is stable
Temperature is controlled
The motion profile is repeatable
The system is not near resonance
The controller has enough torque margin
When You Need a More Advanced Model
A more advanced model may be needed when the system involves the following:
High-speed acceleration
Large payload variation
Flexible fixtures
Vertical motion with gravity effects
High duty cycle
Cleanroom or dusty environments
Long stroke with deflection concerns
Precision positioning below 0.01 mm
Servo tuning instability
In these cases, simulation, testing, and manufacturer data become more important than a simple linear equation.
How Should Engineers Test Linearity in a Real Motion System?
Engineers can test linearity by collecting input-output data across the operating range, plotting the results, fitting a linear model, and checking whether errors remain small, random, and acceptable.
Testing is especially important for custom automation systems because catalog specifications do not fully describe performance after installation.
Practical Linearity Test Procedure
Define the input
The input includes command pulses, voltage, target position, payload mass, speed command, or acceleration.
Define the output
Actual position, force, cycle time, current draw, temperature, or error.
Collect data across the full range
Include low, medium, and high values.
Avoid testing only ideal conditions.
Plot the data
Look for a straight-line pattern.
Fit a linear model
Use regression or engineering calculations.
Analyze residuals
Check whether errors are random.
Repeat under different loads
Test with light, normal, and maximum payloads.
Validate with new data
Do not rely solely on the data used to build the model.
Example Test: Commanded Position vs. Actual Position
Commanded Position (mm)
Actual Position (mm)
Error (mm)
0
0.000
0.000
100
100.004
+0.004
200
200.007
+0.007
300
300.011
+0.011
400
400.016
+0.016
500
500.020
+0.020
This data suggests a nearly linear error trend. Compensation may be possible using a calibration factor. However, if the error suddenly increases in one section, the cause may be mechanical misalignment, screw pitch error, guide rail issue, or sensor problem.
Test Conditions to Record
For professional engineering documentation, always record:
Payload
Speed
Acceleration
Stroke length
Mounting orientation
Temperature
Controller settings
Lubrication condition
Measurement instrument
Repeat count
Direction of motion
This information helps determine whether a linear model remains valid under real operating conditions.
How Do Linear Modules Affect B2B Procurement and System Design?
Linear modules affect B2B procurement because buyers must evaluate technical fit, supply capability, customization options, documentation, classification, and long-term reliability, not only the initial price.
A linear module is not just a mechanical part. It is often a core subsystem that influences machine throughput, accuracy, maintenance, and safety.
What Buyers Should Ask Linear Module Manufacturers
When comparing linear module manufacturers, buyers should ask:
What drive types are available?
What stroke lengths can be customized?
What load capacity is supported horizontally and vertically?
What repeatability and positioning accuracy are specified?
What guideway structure is used?
What motor mounting options are available?
Are cleanroom, dust-proof, or enclosed versions available?
What is the expected maintenance interval?
Can drawings, CAD files, and test reports be provided?
What lead times apply for standard and customized modules?
A supplier should be able to help match the actuator structure to the application instead of recommending one generic solution for every machine.
Linear Module System Considerations
A linear module system may include the following:
Mechanical actuator body
Guide rail or built-in guideway
Belt, ball screw, or direct-drive motor
Coupling or pulley
Motor adapter
Limit sensors
Home sensor
Servo or stepper motor
Controller
Cable carrier
Mounting brackets
Protective cover
Because these components interact, the system may not behave linearly if one part is undersized or poorly integrated.
Linear Module HS Code Considerations
The phrase “linear module HS code” is common in international purchasing. However, HS code classification depends on the product structure, drive method, function, destination country, and customs interpretation.
A linear module may be classified differently depending on whether it is imported as
A mechanical transmission part
A machine component
An actuator assembly
A motorized motion unit
A part of a larger automation system
Buyers should request product drawings, material descriptions, motor details, and intended use documentation, then confirm the correct HS code with a qualified customs broker or local authority.
How Can You Choose Between Linear, Belt, Screw, Motor, and Cylinder Solutions?
You can choose the right linear motion solution by matching the application’s stroke, speed, load, precision, environment, and duty cycle to the drive mechanism.
No actuator type is best for every machine. A long-stroke transfer axis may need a belt-driven module, while a precision inspection axis may require a ball screw or linear motor stage.
Selection Table
Requirement
Best-Fit Option
Reason
Long stroke
Belt-driven module
Efficient over longer travel
High speed
Belt or linear motor
Fast motion and high throughput
High thrust
Ball screw or electric cylinder
Mechanical advantage and rigidity
High precision
Ball screw or linear motor
Better repeatability and accuracy
Low backlash
Linear motor or preloaded screw
Reduced transmission error
Compact pressing
Electric cylinder
Direct force in limited space
Clean environment
Enclosed screw or direct-drive stage
Reduced contamination risk
Cost-sensitive transport
Belt module
Balanced price and speed
For applications that need compact thrust with servo control, an electric cylinder can replace pneumatic cylinders and improve position control, speed adjustment, and force repeatability.
Matching the Model to the Hardware
A linear model may predict that doubling speed halves cycle time. But the hardware may introduce limits:
Motor torque drops at high speed
Belt vibration increases with stroke length
A screw whip limits rotational speed
Linear motors require thermal management
Payload inertia affects acceleration
Vertical axes require brake or counterbalance
Controller tuning affects settling time
Therefore, actuator selection should combine mathematical modeling with mechanical engineering judgment.
Questions Before Final Selection
Before choosing linear actuators, define the following:
Required stroke
Payload mass
Mounting orientation
Required speed
Required acceleration
Positioning accuracy
Repeatability
Cycle frequency
Environmental conditions
Available installation space
Motor and controller preference
Maintenance expectations
These inputs allow a manufacturer or engineering team to recommend the correct linear module system rather than oversizing or undersizing the axis.
What Are the Key Takeaways for Identifying Linear Models?
The key takeaway is that a model is linear when it has a constant rate of change, additive structure, and predictable proportional behavior within a defined range.
For mathematics and statistics, linearity depends on equation form, graphs, residuals, and parameter structure. For automation and linear actuators, linearity also depends on the physical operating range, mechanical stiffness, friction, controller behavior, and environmental stability.
A practical decision process looks like this:
Start with the equation
Can it be written as constants multiplied by inputs and added together?
Check the data
Do equal input changes produce equal output changes?
Plot the graph
Does it form a straight line?
Compare differences and ratios
Constant difference suggests linear.
Constant ratio suggests exponential.
Analyze residuals
Random residuals support a linear model.
Curved residuals suggest nonlinear behavior.
Validate physically
Does the model match real actuator behavior?
Limit the operating range
A linear model may be valid only under specific load, speed, and temperature conditions.
For industrial automation, linear models are powerful tools, but they should not replace engineering validation. The best results come from combining mathematical clarity with correct product selection, careful testing, and realistic operating assumptions.
FAQ
The following questions expand common search intent around linear models, linear actuators, and industrial motion selection.
Can a model be linear if it has multiple variables?
Yes. A model can have many variables and still be linear if the variables are added together after being multiplied by constants. For example, (y = b_0 + b_1x_1 + b_2x_2) is a linear equation. Problems occur when variables are multiplied together, placed in exponents, or transformed in ways that create a changing slope unless those transformations are intentionally treated as separate features.
Are linear actuators always controlled by linear models?
No. Linear actuators create straight-line motion, but their control models may be linear, nonlinear, or a combination of both. A simple positioning move may be approximated linearly, while high-speed motion, friction compensation, vibration control, and thermal behavior often require more advanced modeling.
Why does a linear model fail after a machine is installed?
A linear model may fail after installation because real conditions differ from test assumptions. Common causes include mounting misalignment, payload variation, insufficient rigidity, changing friction, temperature rise, controller tuning errors, cable drag, and vibration. Validation under actual production conditions is essential before relying on the model for performance guarantees.
HCY Automation delivers integrated solutions across motion control, linear motion, robotics, machine vision, pneumatic systems, and precision gearboxes to help global manufacturers build smarter, faster, and more reliable production lines. Our engineering team helps you select and integrate the right motion control, robotics, and automation components for your specific application.